Case Studies in QSAR and 3D-QSAR
Info
In this chapter some case studies are presented to illustrate how practical projects can be handled using either Q.S.A.R. or 3D-Q.S.A.R. methodologies.
Number of Pages: 21 (±0 hours read)
Last Modified: December 2008
Prerequisites: None
Case Study-1 : QSAR of Capsaicin Analogs
Example of Capsaicin Analogs
Capsaicin analogs were studied for their analgesic properties and we will use this study to illustrate the derivation of a simple QSAR model. The biological activities (EC50) were measured for some analogs as indicated below. The question is whether on the basis of these data, it is possible to develop a QSAR model and predict the biological activities of new compounds.

articles
Analogues of Capsaicin with Agonist Activity as Novel Analgesic Agents; Structure-Activity Studies. 3. The Hydrophobic Side-Chain C-Region Christopher S.J. Walpole et al. J. Med. Chem. 36 1993
Relevant Descriptors of Capsaicin Analogs
The selection of descriptors that correlate with the target biological activity is mandatory for the derivation of a meaningful QSAR model. For Capsaicin analogs, biological activity appears to be influenced by the lipophilicity of the substituent R. Following this assumption the descriptors deemed most suitable are the molar refractivity (MR) and the hydrophobic substituent constant π.

The Capsaicin Study Table
The following table summarizes the MR and π values which were calculated for the seven Capsaicin analogs. As discussed above, activities (EC50) are expressed as their log values.

articles
Analogues of Capsaicin with Agonist Activity as Novel Analgesic Agents; Structure-Activity Studies. 3. The Hydrophobic Side-Chain C-Region Christopher S.J. Walpole et al. J. Med. Chem. 36 1993
Graphical Analysis of Capsaicin Analogs
For Capsaicin analogs, if we plot the values from the study table for MR and π, respectively, there seems to be a weak correlation between the biological activity and the molar refractivity (MR). However, the hydrophobic substituent constant π shows a possible linear correlation.

articles
Analogues of Capsaicin with Agonist Activity as Novel Analgesic Agents; Structure-Activity Studies. 3. The Hydrophobic Side-Chain C-Region Christopher S.J. Walpole et al. J. Med. Chem. 36 1993
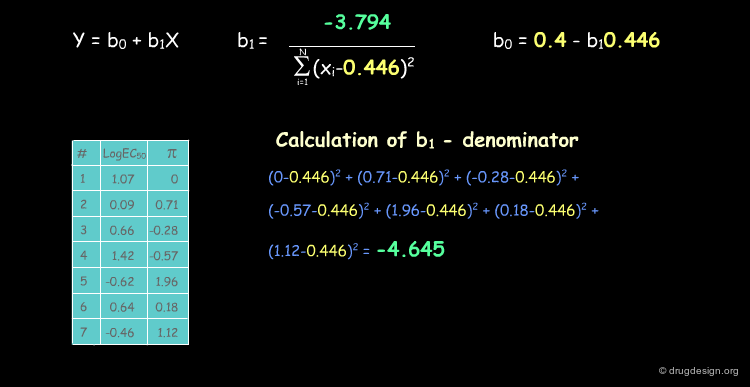
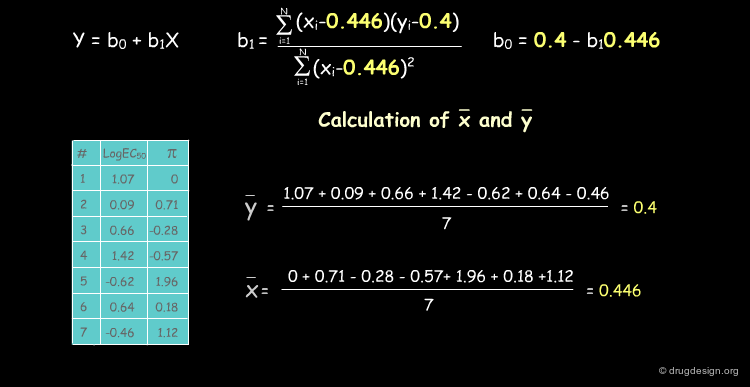
Deriving a QSAR Linear Equation
The correlation between π and the biological activities is represented by the equation y = b0+b1X, where b0 is the intercept of the line with the y axis and b1 the slope of the line. We show below how to calculate their numerical values.


Experimental vs. Calculated Values (1/2)
There is a difference between the experimental and the calculated values as shown below.
articles
Analogues of Capsaicin with Agonist Activity as Novel Analgesic Agents; Structure-Activity Studies. 3. The Hydrophobic Side-Chain C-Region Christopher S.J. Walpole et al. J. Med. Chem. 36 1993
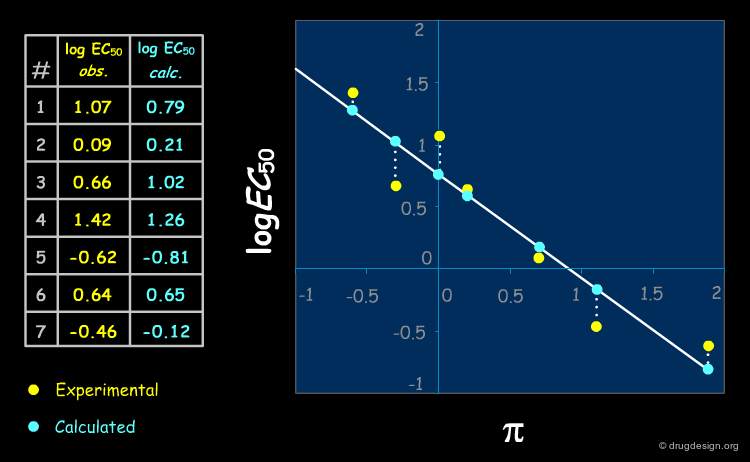
Experimental vs. Calculated Values (2/2)
A simple way to visualize the differences between experimental and calculated values is to plot the measured activity versus the predicted activity. A perfect QSAR model should follow the line y = x.

articles
Analogues of Capsaicin with Agonist Activity as Novel Analgesic Agents; Structure-Activity Studies. 3. The Hydrophobic Side-Chain C-Region Christopher S.J. Walpole et al. J. Med. Chem. 36 1993
Calculating r2 for the Capsaicin analogs
For Capsaicin analogs, r2 is calculated as follows.

articles
Analogues of Capsaicin with Agonist Activity as Novel Analgesic Agents; Structure-Activity Studies. 3. The Hydrophobic Side-Chain C-Region Christopher S.J. Walpole et al. J. Med. Chem. 36 1993
t-test for the Capsaicin Analogs
The steps involved in evaluating the significance of r2 are as follows:


articles
Analogues of Capsaicin with Agonist Activity as Novel Analgesic Agents; Structure-Activity Studies. 3. The Hydrophobic Side-Chain C-Region Christopher S.J. Walpole et al. J. Med. Chem. 36 1993
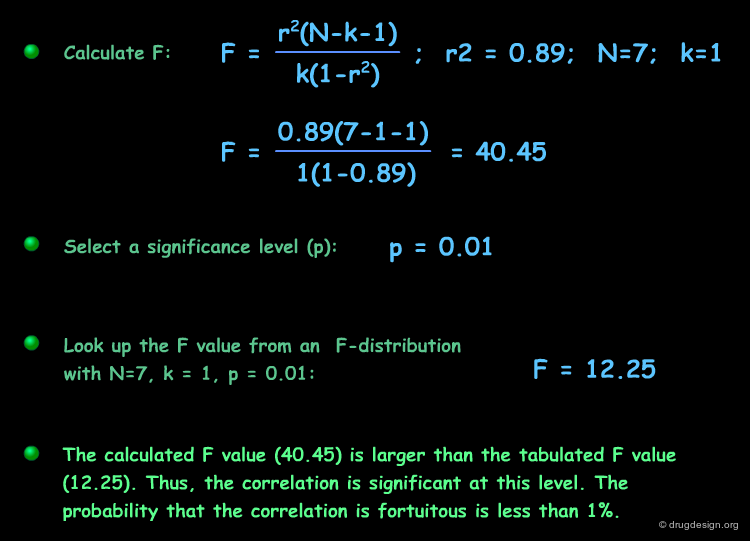
F-test for a Series of the Capsaicin Analogs
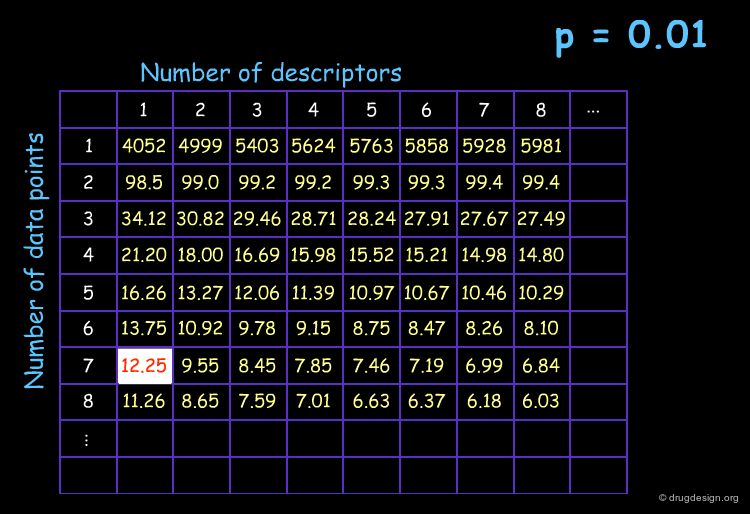
The steps involved for evaluating the significance of r2 using the F-test proceed as indicated below. The F-test analyses finally indicate that a significant correlation is obtained and the probability of a chance correlation is less than 1%.
articles
Analogues of Capsaicin with Agonist Activity as Novel Analgesic Agents; Structure-Activity Studies. 3. The Hydrophobic Side-Chain C-Region Christopher S.J. Walpole et al. J. Med. Chem. 36 1993
The QSAR Equation for the Capsaicin Analogs
QSAR studies reveal the importance of lipophilicity in the analgesic properties of a series of Capsaicin analogs as indicated by the good correlation found with the π descriptor. The correlation coefficient r2 is 0.89 and analyses of the significance of the equation (t-test and F-test) show that there is less than a 5% chance that the relationship is due to chance. This validates the use of π as a descriptor for the structure-activity relationships.

articles
Analogues of Capsaicin with Agonist Activity as Novel Analgesic Agents; Structure-Activity Studies. 3. The Hydrophobic Side-Chain C-Region Christopher S.J. Walpole et al. J. Med. Chem. 36 1993
Predicting the Activities of Unknown Compounds
The derived QSAR model can be used to predict the biological activities of novel capsaicin analogs by introducing their corresponding π values in the QSAR equation. For example, the biological activity of the amide analog indicated below is predicted with an EC50 of 0.98 µM.

articles
Analogues of Capsaicin with Agonist Activity as Novel Analgesic Agents; Structure-Activity Studies. 3. The Hydrophobic Side-Chain C-Region Christopher S.J. Walpole et al. J. Med. Chem. 36 1993
Case Study-2 : 3D-QSAR of Steroid Analogs
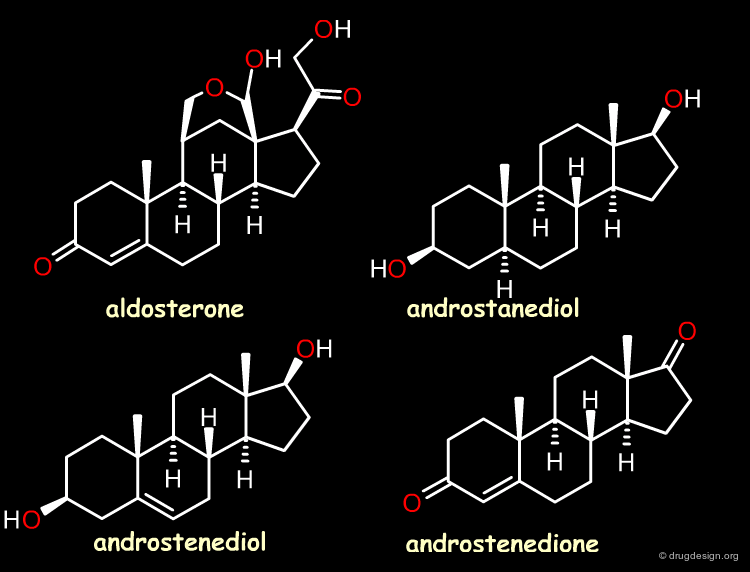
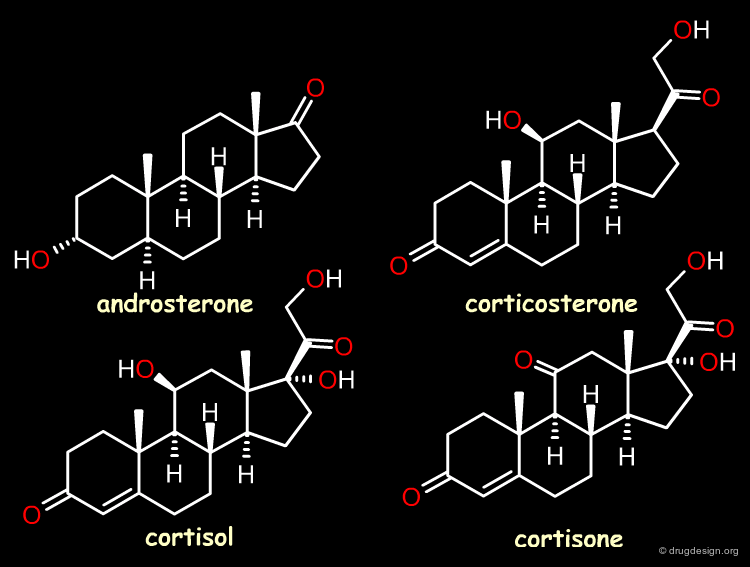
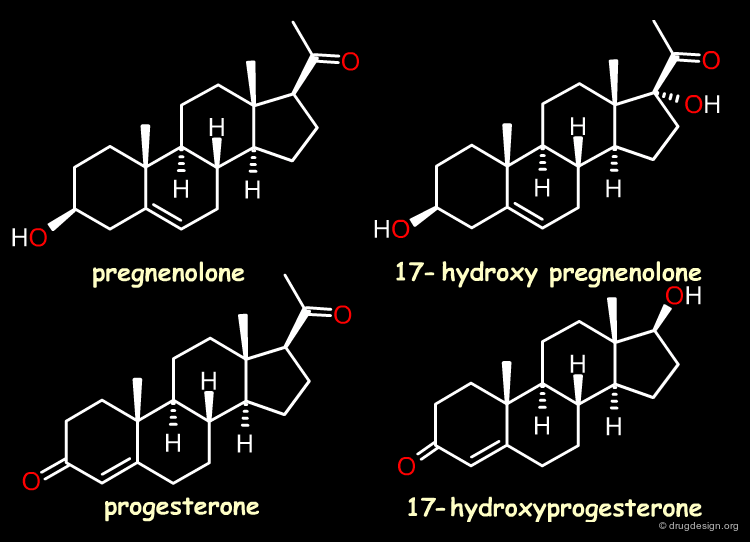
The Reference Compounds
This example was presented by Cramer in the original paper introducing CoMFA. This historical contribution has been cited repeatedly in the literature and often used to illustrate the methodology. The 3D-QSAR approach was developed to analyze the binding affinities of 21 steroid compounds that interact with the following two receptors: the human corticosteroid-binding globulin (CBG) receptor and the human testosterone-binding globulin (TBG) receptor.


articles
Comparative Molecular Field Analysis (CoMFA). 1. Effect of Shape on Binding of Steroids to Carrier Proteins Richard D. Cramer III, David E. Patterson and Jeffrey D. Bunce J. Am. Chem. Soc. 110 1988
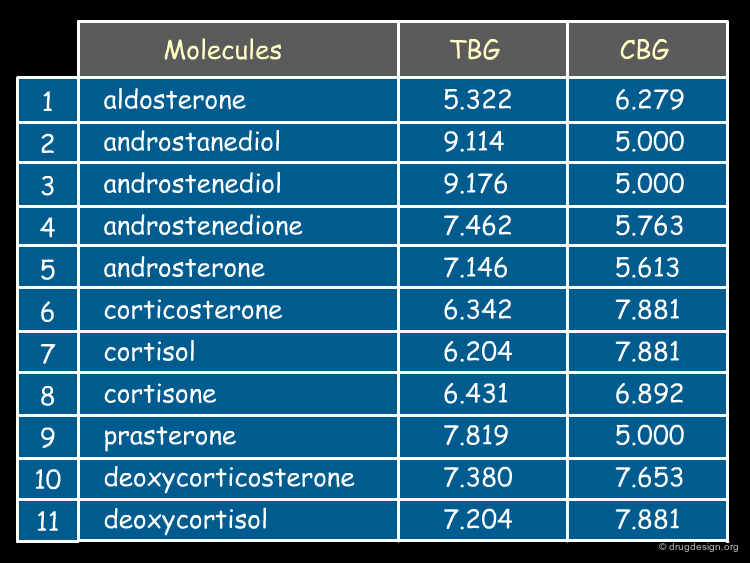
The Biological Data
The binding affinities (expressed as pKi values) of the 21 steroids for the two receptors CBG and TBG are shown below.


articles
Comparative Molecular Field Analysis (CoMFA). 1. Effect of Shape on Binding of Steroids to Carrier Proteins Richard D. Cramer III, David E. Patterson and Jeffrey D. Bunce J. Am. Chem. Soc. 110 1988
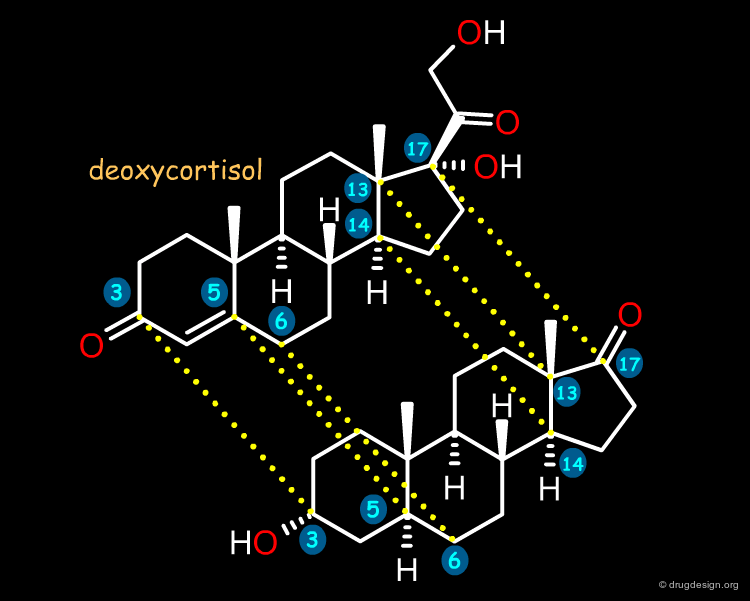
Molecular Alignment
Due to the relative rigidity of the steroid skeleton, alignment was based on a simple rigid-body least-squares fitting of the 3, 5, 6, 13, 14 and 17 carbon atoms of each steroid to the corresponding atoms of deoxycortisol, a steroid with good binding affinity to both globulins. The 21 superimposed steroids are shown below (button "Sup").


articles
Comparative Molecular Field Analysis (CoMFA). 1. Effect of Shape on Binding of Steroids to Carrier Proteins Richard D. Cramer III, David E. Patterson and Jeffrey D. Bunce J. Am. Chem. Soc. 110 1988
CoMFA Field Calculations
The set of 21 aligned steroids was placed in a 3D grid large enough to encompass all structures. The distance between neighboring grid points was about 2Å. Steric and electrostatic grids were calculated using the 6-12 Lennard-Jones and Coulomb potentials respectively, by using an sp3 carbon atom with a +1 charge as a probe.

articles
Comparative Molecular Field Analysis (CoMFA). 1. Effect of Shape on Binding of Steroids to Carrier Proteins Richard D. Cramer III, David E. Patterson and Jeffrey D. Bunce J. Am. Chem. Soc. 110 1988
CoMFA and PLS Results vs. Classical QSAR
Binding affinities to human CBG and TBG were predicted through 3D-QSAR and PLS. The results obtained with the CoMFA methodology were better than those obtained with classical QSAR. Note that only a few descriptors (MR, LogP, MP...) were used for the QSAR; note also that MLR (multiple linear regression) cannot handle the huge amount of data generated by CoMFA calculations.

articles
Comparative Molecular Field Analysis (CoMFA). 1. Effect of Shape on Binding of Steroids to Carrier Proteins Richard D. Cramer III, David E. Patterson and Jeffrey D. Bunce J. Am. Chem. Soc. 110 1988
Steric CoMFA Map for Binding to TBG
As revealed by the CoMFA regression coefficients, the steric 3D contour maps around testosterone for TBG affinities are presented below. Regions where bulky substituents enhance the binding affinity are shown in green, whereas regions where bulky substituents reduce the binding affinity are shown in yellow.

articles
Comparative Molecular Field Analysis (CoMFA). 1. Effect of Shape on Binding of Steroids to Carrier Proteins Richard D. Cramer III, David E. Patterson and Jeffrey D. Bunce J. Am. Chem. Soc. 110 1988
Electrostatic CoMFA Map for Binding to TBG
The electrostatic 3D contour maps around testosterone for TBG affinities are presented below. Regions where electronegative substituents enhance the binding affinity are shown in red, and regions where electronegative substituents reduce the binding affinity are shown in blue.

articles
Comparative Molecular Field Analysis (CoMFA). 1. Effect of Shape on Binding of Steroids to Carrier Proteins Richard D. Cramer III, David E. Patterson and Jeffrey D. Bunce J. Am. Chem. Soc. 110 1988
CBG Affinities of New Steroids
After completion of the CoMFA analyses, the binding affinities to human CBG (corticosteroid-binding globulin) of a set of 10 new steroids became available.


articles
Comparative Molecular Field Analysis (CoMFA). 1. Effect of Shape on Binding of Steroids to Carrier Proteins Richard D. Cramer III, David E. Patterson and Jeffrey D. Bunce J. Am. Chem. Soc. 110 1988
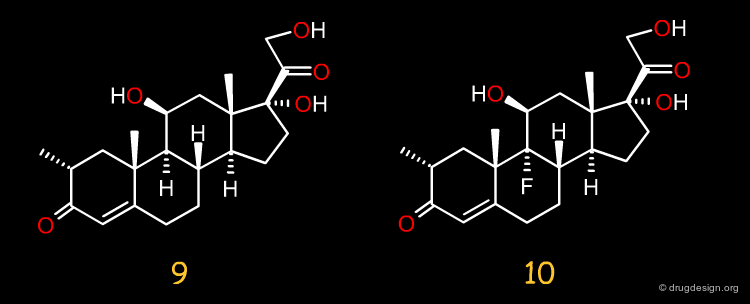
Predicting the CBG Affinities of New Steroids
The 3D-QSAR equation derived by CoMFA was used to predict the binding affinities to the human CBG receptor of these 10 new steroids leading to a predictive r2 value of 0.65; if compounds 1, 9 and 10 are removed from this analysis, r2 increases to 0.81. The steroid data set presented here has now become a standard set for the validation of any novel 3D-QSAR approach.


articles
Comparative Molecular Field Analysis (CoMFA). 1. Effect of Shape on Binding of Steroids to Carrier Proteins Richard D. Cramer III, David E. Patterson and Jeffrey D. Bunce J. Am. Chem. Soc. 110 1988
Copyright © 2024 drugdesign.org